
About
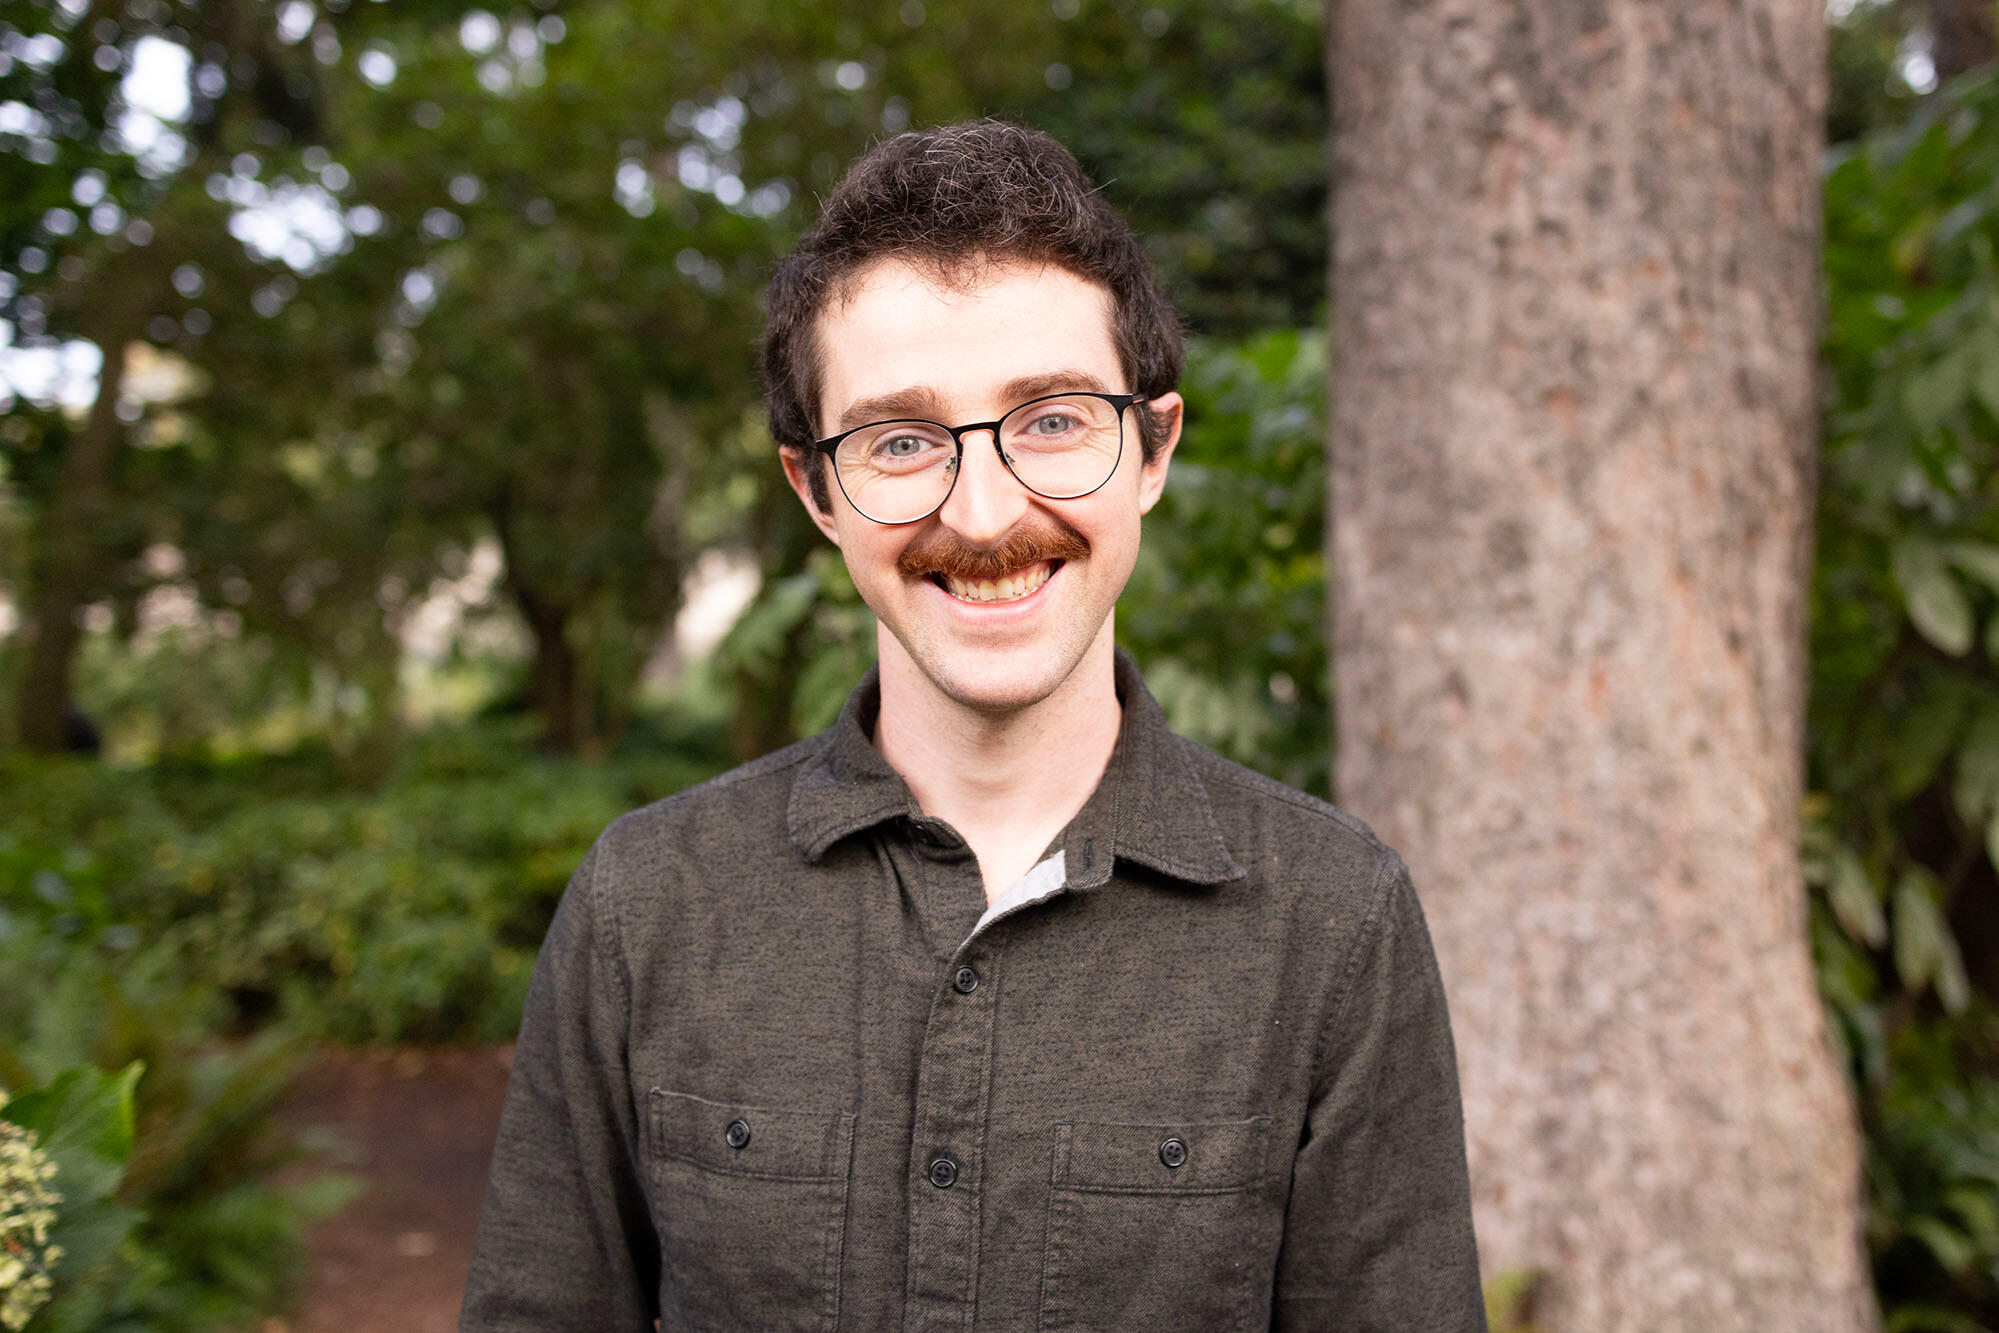
I'm a multimedia journalist from the Pacific Northwest. I specialize in video and audio production, as well as science and environmental journalism. My work has won numerous awards, including a AAAS Kavli Science Journalism Award, a National Academy of Sciences Schmidt Award, and more.I graduated magna cum laude with a degree in visual journalism and chemistry at Western Washington University, and was picked as the 2017 Outstanding Graduate by the Western Journalism Department.I'm currently a video producer at Grist, covering climate change, the environment, and science. I've also worked with creators like food writer J. Kenji López-Alt, and wildlife filmmaker Chris Morgan. Before that, I was editor-in-chief at The Planet Magazine, Western Washington University's award-winning environmental magazine.
Awards
| Award | Work | Category | Place | Recipient | Year |
|---|---|---|---|---|---|
| National Academies of Sciences Schmidt Award for Excellence in Science Communication | Proof of Concept | Early Career Science Journalist | Winner | Jesse Nichols | 2025 |
| Society for News Design Best of News Design Awards | Proof of Concept | Special Coverage, Environment & Science | Award of Excellence | Jesse Nichols, Daniel Penner, and Teresa Chin | 2025 |
| Northwest Regional Emmy® Awards | Nature can’t run without parasites. What happens when they start to disappear? | Environment/Science - Short Form Content | Nominee | Jesse Nichols | 2025 |
| AAAS Kavli Science Journalism Awards | Proof of Concept (Season 2) | Video: Spot News/Feature Reporting | Gold | Jesse Nichols | 2024 |
| Northwest Excellence in Journalism Award | Proof of Concept | Best Video Series, Large Newsroom | First Place | Jesse Nichols and Daniel Penner | 2023 |
| ONA Online Journalism Awards | Proof of Concept | Digital Video Storytelling Series, Small/Medium Newsrooms | Finalist | Jesse Nichols and Daniel Penner | 2022 |
| FOLIO Eddie Awards | Proof of Concept | Video, Consumer | Nominee | Jesse Nichols and Daniel Penner | 2022 |
| SPJ Northwest Excellence in Journalism Award | Did DDT play a role in my family’s cancers? | Video, General | Second Place | Jesse Nichols and Regan Bervar | 2021 |
| SPJ Northwest Excellence in Journalism Award | Urban Climate Change and Adaptation Series | Reporting Series | First Place | Jesse Nichols | 2019 |
| FOLIO Rising Star Award | Grist Explainers | Rising Star | — | Jesse Nichols | 2018 |
| SPJ Mark of Excellence Award | Troubled Waters | Online/Digital Feature Videography | National Winner | Jesse Nichols and Kjell Redal | 2018 |
| SPJ Northwest Mark of Excellence Award | Yellow Cedars | Best Radio Feature | First Place | Jesse Nichols | 2017 |
Portfolio
I'm a video producer at Grist. You can check out my latest Grist work here. For other selected video work, check out my reel:
Reel
Selected projects
Proof of Concept
Proof of Concept is an award-winning science video series from Grist. The series — now in its second season — profiles the science and scientists behind some of the most surprising recent environmental research and discoveries.
Grist Explainers
Through a combination of deep reporting and data-driven animation, Grist explainers break down the most important climate information in a fun, engaging way. Click here to see a case study of how I use science, data, and programming to create dynamic visuals.
Graphics, Maps, and Data Visualization
In addition to video, I also make standalone graphics, maps, and interactive visualizations. You can see some selected clips below:
Grist Explainers
Case Study: Wet Bulb Temperature Graphic
In the summer of 2022, I was reporting and producing a story about wet bulb temperatures — a unit of measurement that combines heat and humidity. Wet bulb temperatures are important because they represents the temperature that humans experiences after sweat cools them off. If wet bulb temperatures rise above 95º F — as some parts of the world are starting to experience — the human body has no way to prevent itself from overheating.My goal was to create a data-driven visual to help break down the concept for viewers.I always start my designs with research. In this case, I found a scientific study that created a formula to derive wet bulb temperatures from standard units of heat and relative humidity. Now that I had an equation, I could write an expression to in Adobe After Effects.
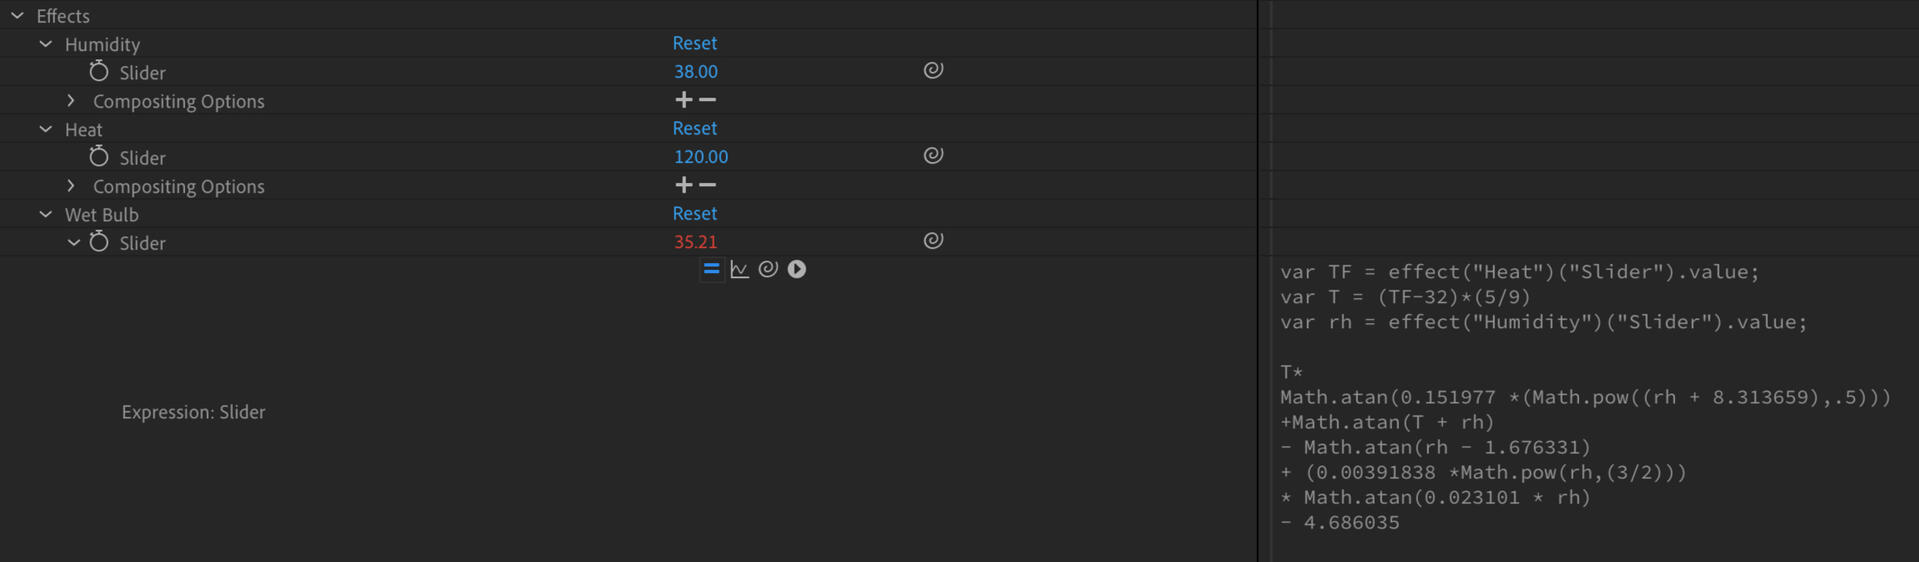
Now that I had the mathematical backbone for the visual, I could start to design the graphic. I started with a rectangle. On one axis, I created a slider icon for humidity. On the other, I created a slider icon for temperature. In the center of the rectangle, I displayed the wet bulb temperature, and color coded the background from yellow to red.
This graphic was a great example of my philosophy of designing engaging visuals rooted in science. You can see the full video here: